Saturday, October 7, 2023

The Morning Star


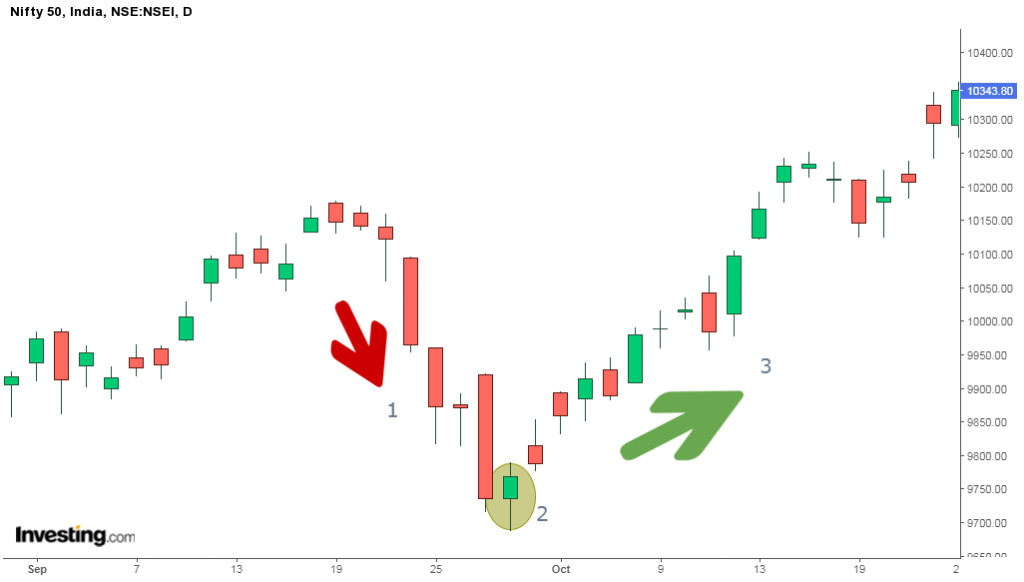
4. The Morning Star:

The Morning Star is a multiple candlestick chart pattern which is formed after a downtrend indicating a bullish reversal.

It is made of 3 candlesticks, the first being a bearish candle, the second a Doji and the third being a bullish candle.

The first candle shows the continuation of the downtrend. The second candle being a doji indicates indecision in the market. The third bullish candle shows that the bulls are back in the market and reversal will take place.

The second candle should be completely out of the real bodies of the first and third candles.

Morning Star Candlestick Pattern

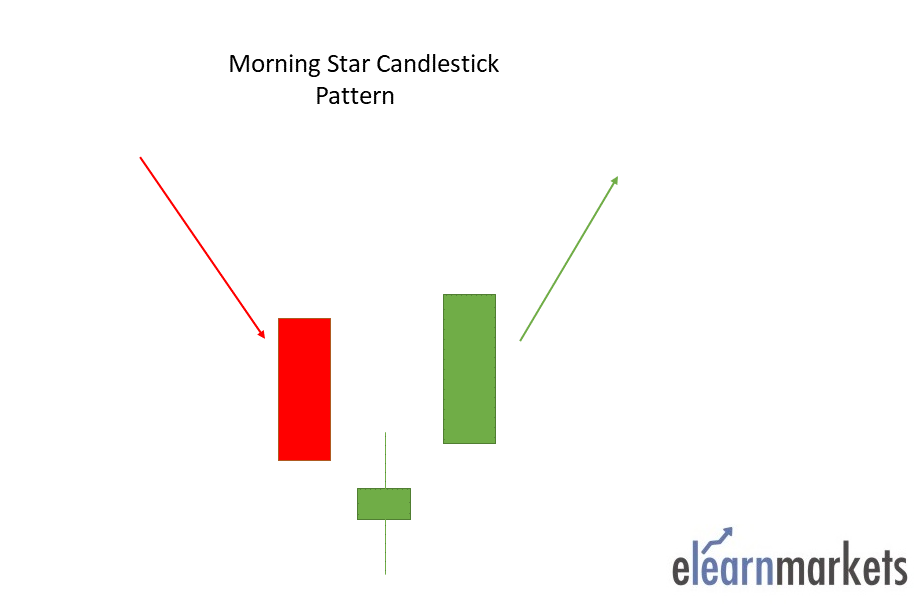
Traders can enter a long position if the next day a bullish candle is formed and can place a stop-loss at the low of the second candle.

Below is an example of Morning Star Candlestick Charts Pattern:

Morning Star Candlestick Charts Pattern

Tuesday, August 22, 2023

REVIEW COMPLETE INTRADAY TRADING SET UP


  1. Doji:

    • The Doji candlestick pattern signifies indecision in the market.
    • It has an open and close price that are very close or identical, resulting in a small or nonexistent body.
    • This pattern suggests that neither bulls nor bears are in control and a potential reversal might occur.

  2. Hammer:

    • A Hammer pattern appears after a downtrend and indicates potential reversal.
    • It has a small body at the upper end of the price range and a long lower wick.
    • This suggests that bears were dominant during the session but lost control, and bulls might be taking over.

  3. Shooting Star:

    • The Shooting Star pattern appears after an uptrend and suggests a potential reversal.
    • It has a small body at the lower end of the price range and a long upper wick.
    • This implies that bulls were dominant during the session but lost control, and bears might be taking over.

  4. Bullish Engulfing:

    • This pattern occurs during a downtrend and suggests a reversal to an uptrend.
    • It features a small bearish candle followed by a larger bullish candle that completely engulfs the previous one.
    • This signals a shift from bearish sentiment to bullish sentiment.

  5. Bearish Engulfing:

    • The Bearish Engulfing pattern appears during an uptrend and indicates a potential reversal to a downtrend.
    • It consists of a small bullish candle followed by a larger bearish candle that engulfs the previous one.
    • This indicates a shift from bullish sentiment to bearish sentiment.

  6. Morning Star:

    • The Morning Star is a three-candle pattern that suggests a reversal from a downtrend to an uptrend.
    • It starts with a long bearish candle, followed by a small bullish or bearish candle, and then a long bullish candle.
    • This signifies a potential change in sentiment, with bears losing control and bulls taking over.

  7. Evening Star:

    • The Evening Star is the opposite of the Morning Star and indicates a reversal from an uptrend to a downtrend.
    • It starts with a long bullish candle, followed by a small bullish or bearish candle, and then a long bearish candle.
    • This implies a potential shift from bullish sentiment to bearish sentiment.

  8. Harami:

    • A Harami pattern suggests a possible reversal in the market.
    • It consists of two candles, where the first one has a large body and the second one is smaller and within the range of the first candle.
    • The second candle's body can be bullish or bearish.
    • This indicates a potential change in sentiment, but confirmation is needed from subsequent price action.

  9. Piercing Pattern:

    • The Piercing Pattern appears after a downtrend and suggests a potential reversal.
    • It has a bearish candle followed by a bullish candle that opens below the previous close but closes above the halfway point of the first candle's body.
    • This indicates potential strength in bulls and a potential reversal.

  10. Dark Cloud Cover:

    • The Dark Cloud Cover is the opposite of the Piercing Pattern and appears after an uptrend.
    • It has a bullish candle followed by a bearish candle that opens above the previous close but closes below the halfway point of the first candle's body.
    • This suggests potential weakness in bulls and a potential reversal.

Wednesday, March 1, 2023

Hammer

1. Hammer:

Hammer is a single candlestick pattern that is formed at the end of a downtrend and signals a bullish reversal.

The real body of this candle is small and is located at the top with a lower shadow which should be more than twice the real body. This candlestick chart pattern has no or little upper shadow.

The psychology behind this candle formation is that the prices opened, and sellers pushed down the prices.

Suddenly the buyers came into the market and pushed the prices up and closed the trading session more than the opening price.

Hammer Candlestick Pattern

This resulted in the formation of bullish pattern and signifies that buyers are back in the market and downtrend may end.

Traders can enter a long position if next day a bullish candle is formed and can place a stop-loss at the low of Hammer.

Below is an example of Hammer candlestick pattern:

Hammer Candle Pattern